Udate:Need Help with al_nleqsolve; Two Questions - How can f(t,u) plot since t is never defined??? - Messages

Here is my example SMATH file.
AL_NLEQSOLVE FIT.sm (20.48 KiB) downloaded 1116 time(s).
Sorry, I forgot to upload the data file. Here it is.
WORLD EMISSION DATA VS DATE.xlsx (24.74 KiB) downloaded 839 time(s).
Two questions:
1. How can the plot of f(t,u) work because t is never defined?
2. I don't understand why my alternate formalism in the cyan box is not equivalent.
Thanks,
Reg

To analyze the second option, the nleqsolve set up is correct, but Plot fails to find the values of a,b,c inside the fit function.

As a final comment, XY Plot can graph expressions with any unknown, while SMath's native plot can also do so, but only with the variable "x".
I hope this clarifies a little why the second option doesn't work.
Best regards.
Alvaro.
Thanks much. I understand that.
Here is my second question as reference in my pm to you. Actually it's two question?
1. How did you make the Data2 resident so the xlsx file is not needed.
2. Because the emissions level off between 2014-2023, I am trying to switch from the exponential fit up to 2014 to a linear fit between 2014-2023 and extend that forward. Here is my attempt.
CO2 FORCING SATURATION STUDY working.sm (46.23 KiB) downloaded 1105 time(s).
WORLD EMISSION DATA VS DATE.xlsx (24.88 KiB) downloaded 787 time(s).
I get the linear result; however, it does not fit the data between 2014-2023. If I try to redefine X to XX for a subset of the data, I get the rows and columns don't match error as noted in the SMATH FILE. This redefinition of the data to a subset resembles how it would be done in MATHCAD to fit a subsection of data.
Thanks again,
Reg
WroteAlvaro,
Thanks much. I understand that.
Here is my second question as reference in my pm to you. Actually it's two question?
1. How did you make the Data2 resident so the xlsx file is not needed.
2. Because the emissions level off between 2014-2023, I am trying to switch from the exponential fit up to 2014 to a linear fit between 2014-2023 and extend that forward. Here is my attempt.
CO2 FORCING SATURATION STUDY working.sm (46.23 KiB) downloaded 1105 time(s).
WORLD EMISSION DATA VS DATE.xlsx (24.88 KiB) downloaded 787 time(s).
I get the linear result; however, it does not fit the data between 2014-2023. If I try to redefine X to XX for a subset of the data, I get the rows and columns don't match error as noted in the SMATH FILE. This redefinition of the data to a subset resembles how it would be done in MATHCAD to fit a subsection of data.
Thanks again,
Reg
Hi Reg.
1. I use the "SMathMatrixEditor" utility from this post.
2. In general, you cannot vectorize matrix functions. In particular, in this case, you cannot vectorize "el(u,1)". In order to vectorize, the matrix functions that are required must already be evaluated, so it is necessary to introduce a and b

CO2 FORCING SATURATION STUDY working 2.sm (73.29 KiB) downloaded 1133 time(s).
Best regards.
Alvaro.
As always, t thanks much.
1. I need some time to work on embedding the Excel data into my SMATH spreadsheet.
2. There are some subtle things in SMATH that I do not understand yet, especially with al_nleqsolve.
Now, I need to incorporate your corrections into the integrals for the total CO2 concentration. I need to convert FIT2 to a function of a variable that can be used in the integral over s from 2014 to enddate.
This is where I was headed.
CO2 FORCING SATURATION STUDY.sm (55.31 KiB) downloaded 1172 time(s).
Thanks again,
Reg
CO2 FORCING SATURATION STUDY 2.sm (63.15 KiB) downloaded 1186 time(s).
Best regards,
Alvaro
Thanks as always.
You are a much more sophisticated programmer than me. I am rather pedestrian.
Here is my almost final version. It includes the Temperature Anomaly Calculation. I just need to add the satellite and surface data in the graph.
CO2 FORCING SATURATION STUDY W-EMBEDDED DATA.sm (192.73 KiB) downloaded 1100 time(s).
The method you showed me for embedding data files is really useful.
Infrequently, SMATH crashes on me. It may be my 10 year old computer. When I include a separator in my file, and then try to move it with the mouse, it totally destroys all of my graph settings to the point that I have to delete the graphs and start over. This is how I move areas; so I thought I could move the separator the same way. If I add and delete spaces with the cursor and my keyboard that works fine. So, I have stopped using separators.
Take care.
Reg
WroteHi Reg.
1. I use the "SMathMatrixEditor" utility from this post.
Wow, I remembered first day I found this executable.
And now I realized this is not imported to SMath as native tool.
This should be a feature, not a separate tool.
Regards
Reg
Wrote... Infrequently, SMATH crashes on me. It may be my 10 year old computer. When I include a separator in my file, and then try to move it with the mouse, it totally destroys all of my graph settings to the point that I have to delete the graphs and start over. This is how I move areas; so I thought I could move the separator the same way. If I add and delete spaces with the cursor and my keyboard that works fine. So, I have stopped using separators.
On my Windows too, on 32 and 64 bit machines. If I want to move an area, I collapse it, cut it and paste it to the desired destination.
My version has a discrepancy with yours, although I don't understand where it could be: I check them and according to me they should be the same. (Area in yellow)
CO2 FORCING SATURATION STUDY 2.sm (116.6 KiB) downloaded 1176 time(s).
CO2 FORCING SATURATION STUDY 2.pdf (634.17 KiB) downloaded 636 time(s).
Best regards.
Alvaro.
I have attached a pdf of my MATHCAD file that supposedly does the same calculation. There are small differences here also, but they manifest in a rather large difference in the result when the emission model reaches 1.5 °C. MATHCAD predicts 2128 and SMATH predicts 2120 for the same input constants…I think.
But we physicists usually do estimates to an order of magnitude. We are very happy with a factor of two. Our difference of 1233.2524/1156.6686 =1.07 makes us ecstatic.
MATHCAD CO2 FORCING.pdf (603.43 KiB) downloaded 636 time(s).
CO2 FORCING WITH SMATH.pdf (1 MiB) downloaded 566 time(s).
CO2 FORCING SATURATION STUDY W-EMBEDDED DATA.sm (593.32 KiB) downloaded 1194 time(s).
I was not aware of the ODE solver; thanks for giving me more new information about SMATH.
I am becoming more comfortable with SMATH, although my long history with MATHCAD causes me to stumble frequently due to the small differences. One thing I really miss is MATHCAD’s plotting functions. I really miss the Trace function and the markers. But I can live with that if I am forced to get a new computer. Since PTC took over MATHCAD, they have stopped supporting MATHCAD 15, which is my version. Even though I have a perpetual license, they will not help me install it on a new computer. There a numerous negative reviews of PTC.
Take care,
Reg
Two things;
1. How do you create this syntax for Rkadapt.
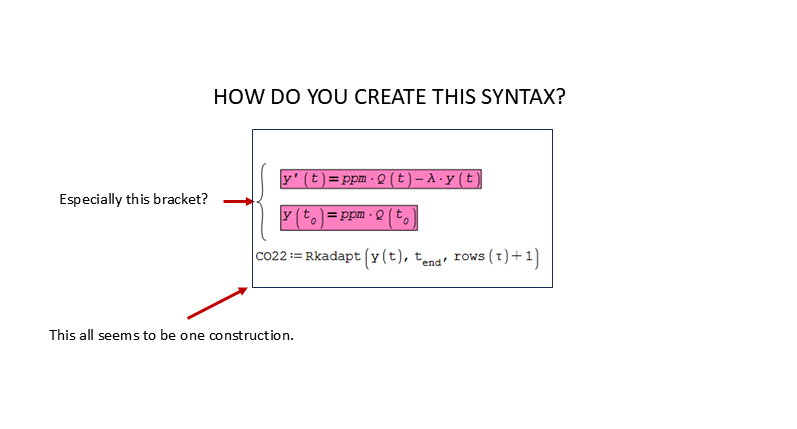
2. Your integral over tk is equal to my Y as far as I can tell.
CO2 FORCING SATURATION STUDY NEW.sm (599.66 KiB) downloaded 1136 time(s).
I have tried numerous things, but I still don't understand the difference in the two methods.
Thanks much.
Reg
MATHCAD produces the same discrepancy between the two integral methods.


Reg
Wrote... 1. How do you create this syntax for Rkadapt. ...
It is the syntax for an ode solver using the "Mathcad toolbox"
Wrote... 2. Your integral over tk is equal to my Y as far as I can tell.
Thank you for confirming that I am not making some basic mistake, at least the mistake is somewhat hidden, in case there is one. If it were a derivative, one can expect anything, since it is a very unstable numerical procedure, but when it comes to integrals it is supposed to be stable and robust. What's more, it is supposed to be continuous on the right, but one can always find examples that complicate things.
Best regards.
Alvaro.
- New Posts
- No New Posts