1 Pages (9 items)
evaluation of plot region - Messages
#1 Posted: 9/21/2020 4:39:28 AM
Hello, it would help making nicer engineering sheets if the plot regions could be placed side-by-side with the data entered, and not below it. Because generally we like to see what is the result, graphically, of the data entered just as we enter it, and not scroll down.
To achieve that I sometimes use global variables, but the problem with these variables is that their value can be assigned only once, so it doesn't allow copy-paste of blocks of calculations/plots, which is a very, very convenient feature of smath, for comparing load cases for examples. So if I want my plot side-by-side with the calculation I have to use global variables (which are also slow and require 2 times and sometimes 3 times evaluation) and one different sheet per load case which is also not convenient.
I wonder if it would be possible to allow a plot region to use all the variables defined above the BOTTOM of the plot, and not just those defined above the top. Since the plot in itself doesn't change any variable value, I guess it should be possible. Just a sort of "shifting the window upwards".
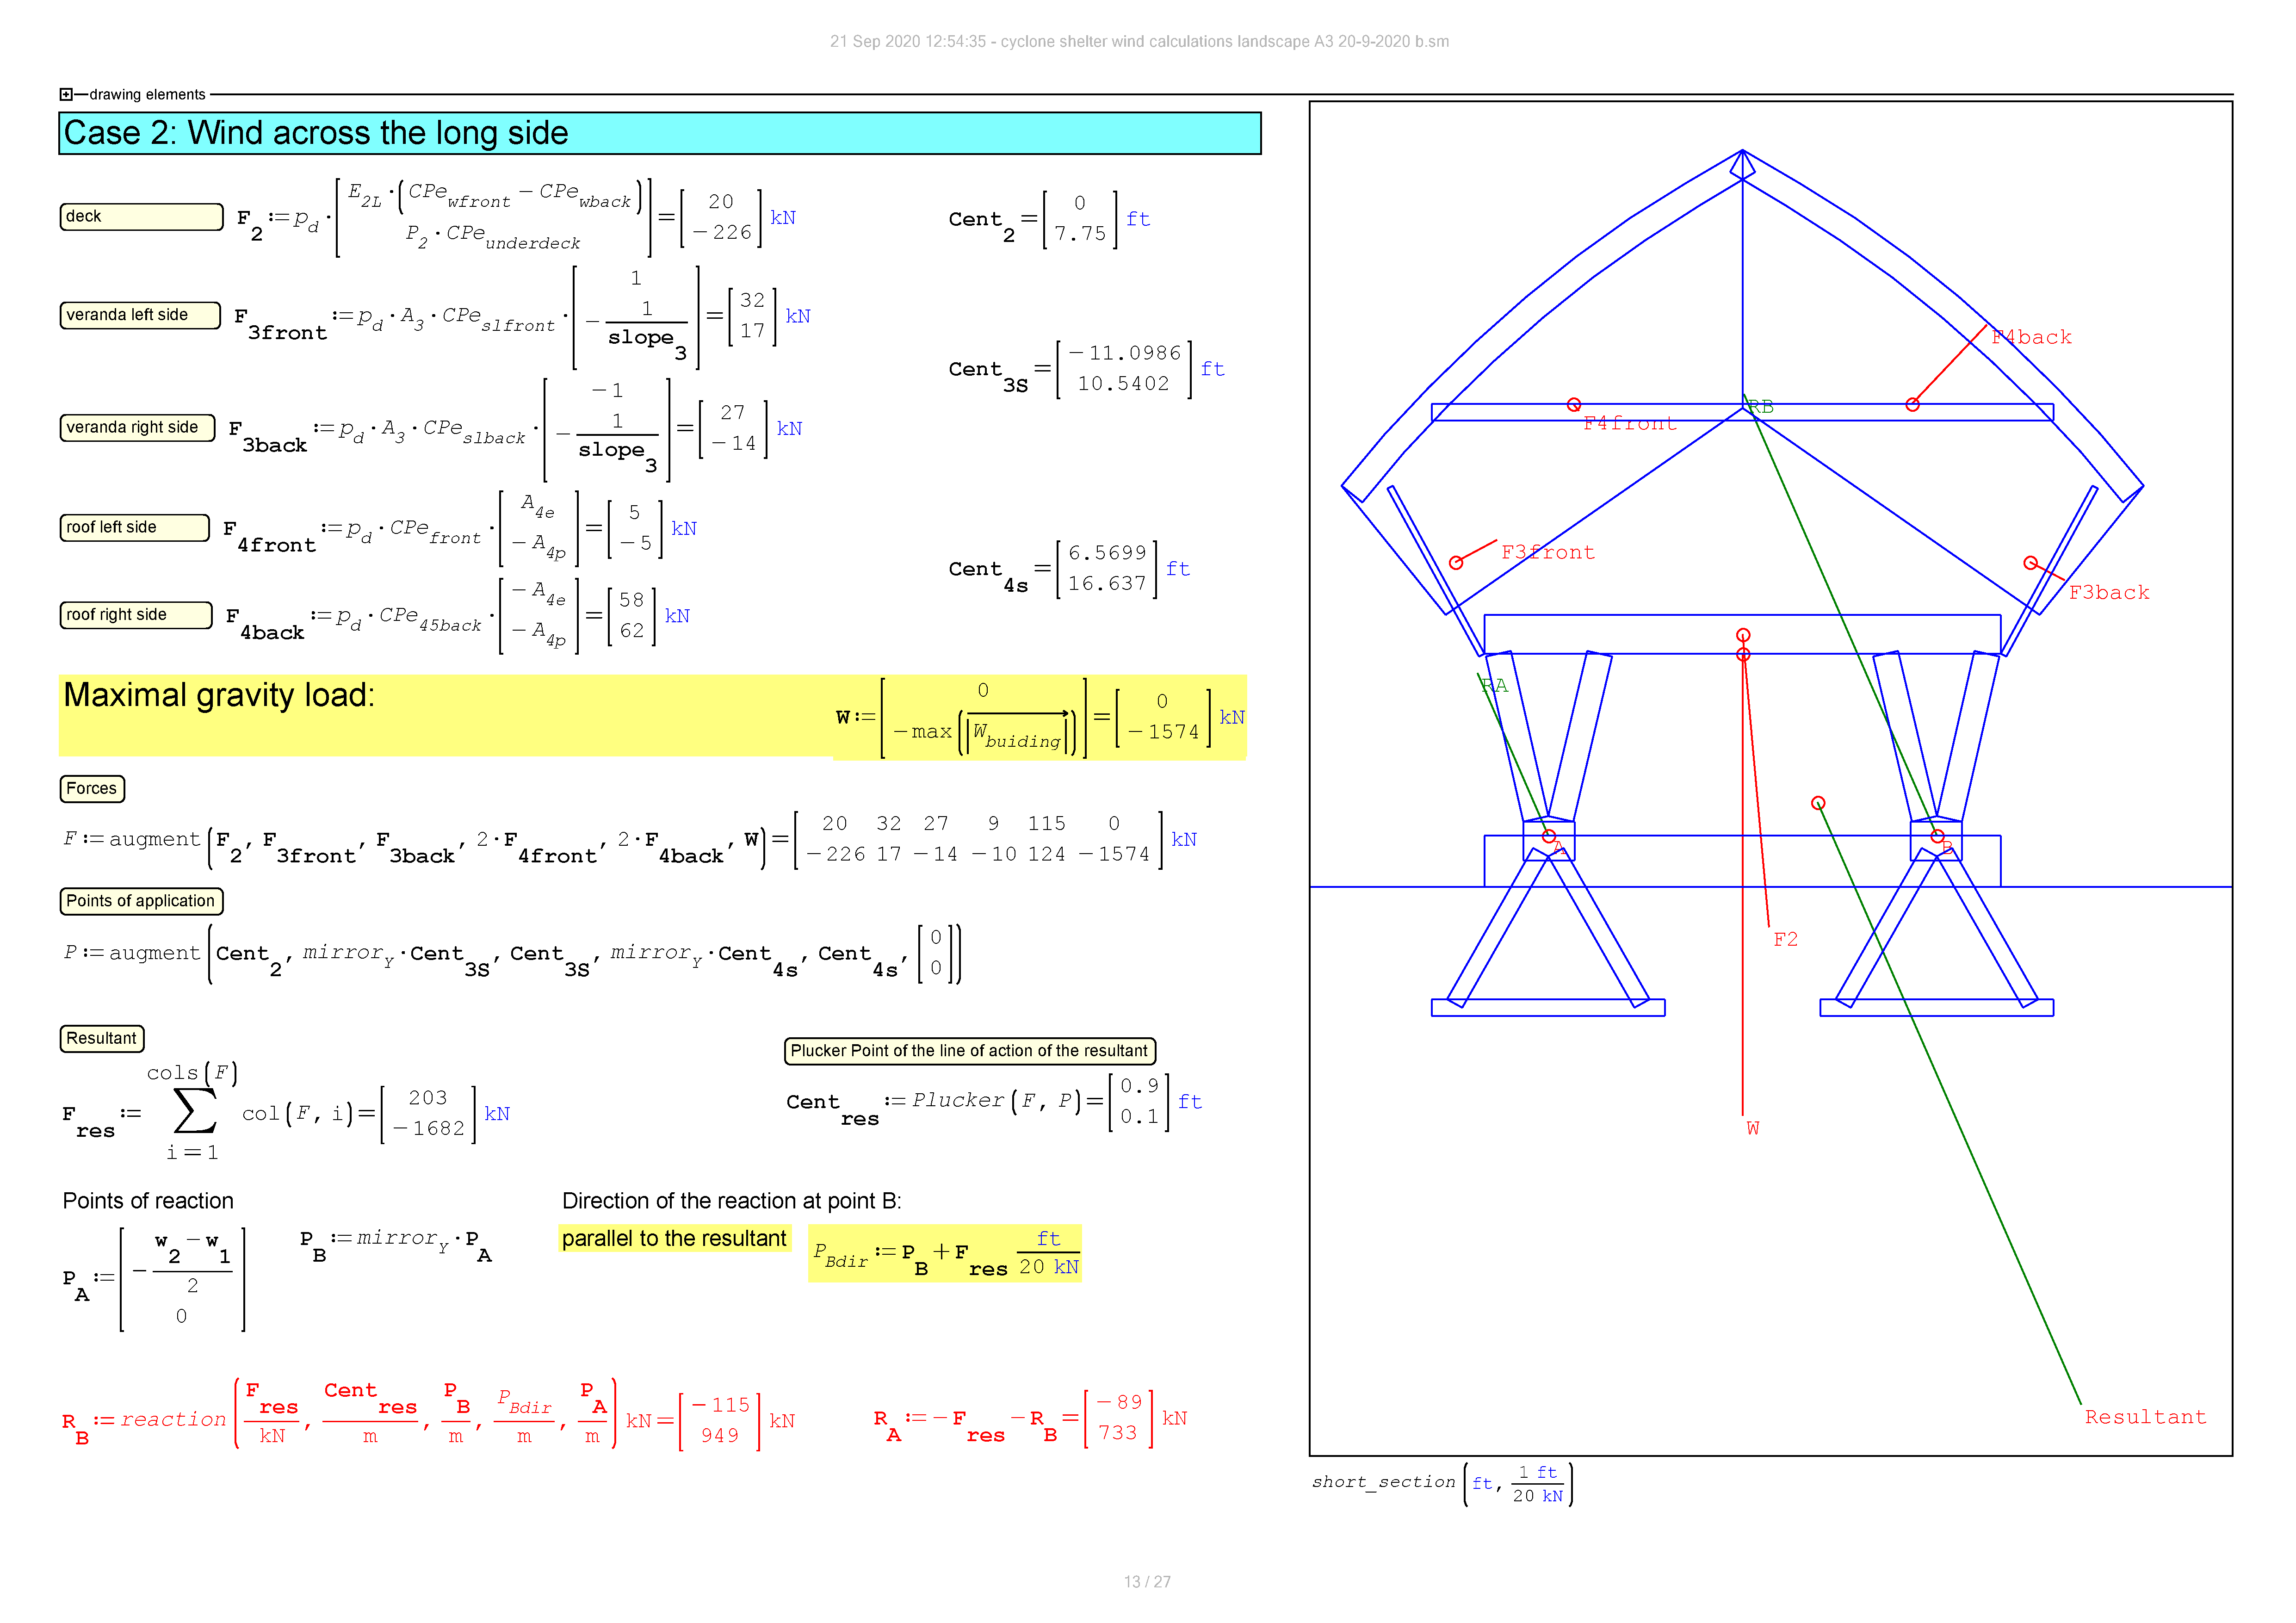
Attached below an example of wind calculation for a bamboo cyclone shelter, illustrating how the calculations can be made easier to understand when the plot besides and not under them. This sheet is made with global variables. The plot elements are defined in the collapsed region called "drawing elements" just on top of the page. I like this look as it allows easy verification of the data and possible errors, with the plot just next to it, but it doesn't allow copy-pasting of this page in the same sheet unless we create new variables for each case, which is cumbersome.
Thank you,
Laurent
moderator: high dpi images moved inside spoilers for easier fruition of the thread.
Click on the "show spoiler" button to see the images
#2 Posted: 9/21/2020 7:34:45 AM
You could use a text region with embedded math. Then everything inside is available outside starting from the top left corner of the region. Inside the region the sequence is serial according to text flow.
![2020-09-21 12_30_43-SMath Studio - [Blatt7_].png](/en-US/files/Download/BxvPoq/2020-09-21-12_30_43-SMath-Studio---[Blatt7_].png)
textregion.sm (3.41 KiB) downloaded 1068 time(s).
textregion.sm (3.41 KiB) downloaded 1068 time(s).
Technische Mechanik mit SMath Studio: https://link.springer.com/book/10.1007/978-3-658-50592-9
1 users liked this post
Andrey Ivashov 9/21/2020 6:27:00 PM
#3 Posted: 9/21/2020 8:09:20 AM
Dear Martin, that's fantastic!
I also just read the thread on "Edit workflow for text regions with embedded math" and I think Andrei's project is just spot-on! He is right, in calculations a clear, simple and beautiful presentation is everything. After all a calculation is a concept, and in conveying a concept, aesthetics is essential, not accessory...
Thank you so much for your so quick help.
Thank you dear Andrei for making such a wonderfully simple software, where freedom is at the core, available for free!
Laurent
#4 Posted: 9/21/2020 10:02:58 AM
Wrotein calculations a clear, simple and beautiful presentation is everything. After all a calculation is a concept, and in conveying a concept, aesthetics is essential, not accessory...
There are zillions of top publishing styles in Samples
#5 Posted: 9/21/2020 11:29:14 AM
Hello, it would help making nicer engineering sheets if the plot
regions could be placed side-by-side with the data entered,
and not below it. Because generally we like to see what is the result,
graphically, of the data entered just as we enter it, and not scroll
down.
To achieve that I sometimes use global variables, but the problem with
these variables is that their value can be assigned only once, so it
doesn't allow copy-paste of blocks of calculations/plots, which is a
very, very convenient feature of smath, for comparing load cases for
examples. So if I want my plot side-by-side with the calculation
I have to use global variables (which are also slow and require
2 times and sometimes 3 times evaluation) and one different sheet
per load case which is also not convenient.
I wonder if it would be possible to allow a plot region to use all the variables defined above the BOTTOM of the plot, and not just those defined above the top. Since the plot in itself doesn't change any variable value, I guess it should be possible. Just a sort of "shifting the window upwards".
Attached below an example of wind calculation for a bamboo cyclone shelter, illustrating how the calculations can be made easier to understand when the plot besides and not under them. This sheet is made with global variables. The plot elements are defined in the collapsed region called "drawing elements" just on top of the page. I like this look as it allows easy verification of the data and possible errors, with the plot just next to it, but it doesn't allow copy-pasting of this page in the same sheet unless we create new variables for each case, which is cumbersome.
Your snippet is way too big for small laptop screen.
#6 Posted: 9/21/2020 4:34:09 PM

That's because the screenshots were made in a high dpi environment. I've moved both the images inside those "show spoiler" buttons, so both the post and thread are easier to read now. 
If you like my plugins please consider to support the program buying a license; for personal contributions to me: paypal.me/dcprojects
2 users liked this post
#7 Posted: 9/22/2020 2:43:34 AM
WroteYou could use a text region with embedded math. Then everything inside is available outside starting from the top left corner of the region. Inside the region the sequence is serial according to text flow.
textregion.sm (3.41 KiB) downloaded 1068 time(s).
I was not aware of this feature, this software is getting better by the day
#8 Posted: 9/22/2020 4:04:03 AM
WroteThat's because the screenshots were made in a high dpi environment. I've moved both the images inside those "show spoiler" buttons, so both the post and thread are easier to read now.
Thank you Davide! I wanted to erase and resend in smaller resolution, but couldn't find the way. But you have done it for me, thank you so much.
Yes this software is getting awesome, very efficient, and the community around it is quite extraordinary!

#9 Posted: 9/24/2020 12:03:09 PM
WroteYes this software is getting awesome, very efficient,
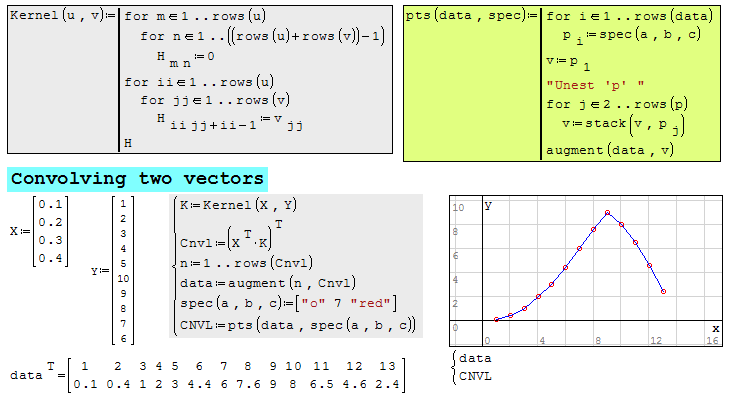
Revisit the last example ... !
Fourier Convol Kernel Algebra.sm (86.59 KiB) downloaded 1117 time(s).
1 Pages (9 items)
- New Posts
- No New Posts