1 Pages (4 items)
How to tell which color corresponds to each function - Messages
#1 Posted: 6/9/2011 10:47:35 AM
Hello
Is there a way of telling which color corresponds to each function as in this kind of graph in Mathcad ?

Is there a way of telling which color corresponds to each function as in this kind of graph in Mathcad ?

#2 Posted: 6/10/2011 2:15:24 AM
Hello,
As far as I know you can not change the color of lines in plots, at the moment.
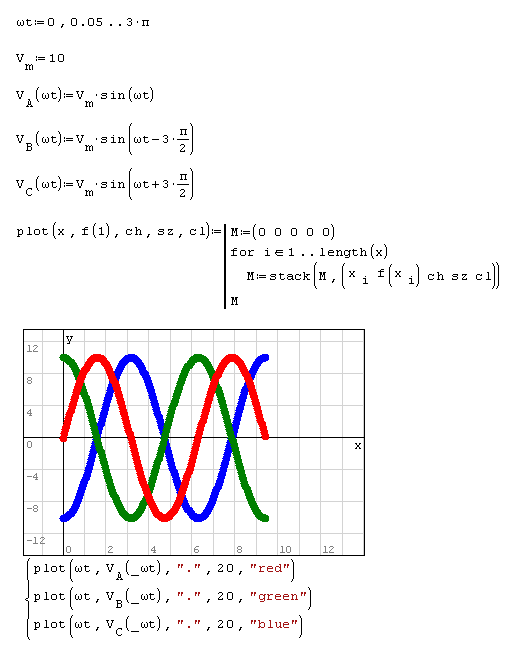
At least you could do as a workaround is to make 2D plots with five column matrix (see Graph constructions , please). There you could use dots (points) of different size and colors. Here is an example of using user defined plot() function:

You can use the step small enough in order to get points stick together and look like a line.
Pay attention that this plotting capabilities are still a work in progress and therefore if you take rather small step (lots of points) and dozen of functions, SMath will take quite a lot of time to plot that.
Regards,
Radovan
As far as I know you can not change the color of lines in plots, at the moment.
At least you could do as a workaround is to make 2D plots with five column matrix (see Graph constructions , please). There you could use dots (points) of different size and colors. Here is an example of using user defined plot() function:
You can use the step small enough in order to get points stick together and look like a line.
Pay attention that this plotting capabilities are still a work in progress and therefore if you take rather small step (lots of points) and dozen of functions, SMath will take quite a lot of time to plot that.
Regards,
Radovan
When Sisyphus climbed to the top of a hill, they said: "Wrong boulder!"
#3 Posted: 6/10/2011 5:47:09 AM
Hello,
the color in the 2d graph comes in the follow order:
1. blue
2. red
3. green
4. magenta
5. orange
6. brown
The 7th function starts again with blue
(SMath 0.89 build 8; Windows XP SP3)
Regards,
Peter
the color in the 2d graph comes in the follow order:
1. blue
2. red
3. green
4. magenta
5. orange
6. brown
The 7th function starts again with blue
(SMath 0.89 build 8; Windows XP SP3)
Regards,
Peter
#4 Posted: 6/10/2011 7:05:15 AM
Hello,
Peter is right. This is the default color set when using the function plotting (similar to "Quick Graph" in Mcad except the function argument must be "x" in SMath 2D plot, and "x","y" in 3D plots) and it could not be changed. As far as I know, the only thing you can change in those plots is "Graph by points" or "Graph by lines". We hope that some additional plot controls would be introduced sooner or later. On the other hand, the introduced "five columns" matrix plot is quite useful for adding text inside the plot region in different size and colors (I think Mcad does not have this), or for making scatter plots with different symbols.
Regards,
Radovan
Wrote
1. blue
2. red
3. green
4. magenta
5. orange
6. brown
The 7th function starts again with blue
(SMath 0.89 build 8; Windows XP SP3)
Peter is right. This is the default color set when using the function plotting (similar to "Quick Graph" in Mcad except the function argument must be "x" in SMath 2D plot, and "x","y" in 3D plots) and it could not be changed. As far as I know, the only thing you can change in those plots is "Graph by points" or "Graph by lines". We hope that some additional plot controls would be introduced sooner or later. On the other hand, the introduced "five columns" matrix plot is quite useful for adding text inside the plot region in different size and colors (I think Mcad does not have this), or for making scatter plots with different symbols.
Regards,
Radovan
When Sisyphus climbed to the top of a hill, they said: "Wrong boulder!"
1 Pages (4 items)
-
 New Posts
-
 No New Posts
