ZedGraph Region - Extends SMath Studio with a ZedGraph Region. - Сообщения
WroteUpdated. Experimental build. Be careful with this. You need to update X-Y Plot first.
Файл не найден. Файл не найден.
P.S. "Name" property is not saved. This will be more difficult to fix, as component uses a binary format for storing settings.
Thank's a lot!!! This is exactly what I was looking for.
You are genius.
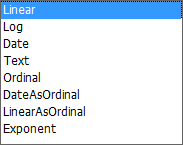
2. click/click to open Zed all spec
Same for less vs same for more !
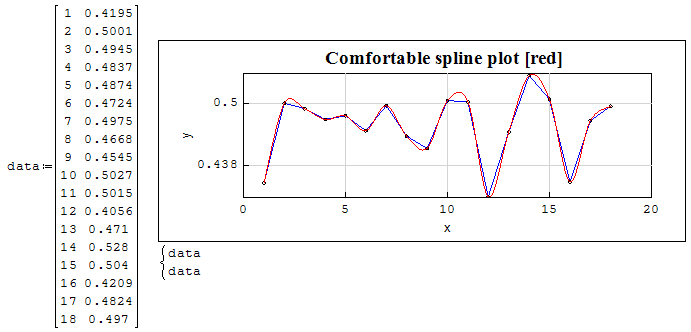
Stupid Zed ... missing the most delicious line "spline".
Also, is it possible to alter the numbers along the axis when log scale is chosen such that the numbers is not written in 10^x?

The external design is not yet fully tested, but you can do this.
problem_log (uni).sm (691,62 КиБ) скачан 1182 раз(а).

WroteI think it is possible if I change the plugin. I'll try do that.
The external design is not yet fully tested, but you can do this.
Thank you. Do you think it's possible to make Zedgraph plot my function when the function uses if() instead of cases() to break the for loop?
(in the sheet cases() is used to break the loop, but cases() doesn't actually work.. no iterations are made, the loop is broken after the first run).
WroteThank you. Do you think it's possible to make Zedgraph plot my function when the function uses if() instead of cases() to break the for loop?
Updated. Try now.
WroteWroteThank you. Do you think it's possible to make Zedgraph plot my function when the function uses if() instead of cases() to break the for loop?
Updated. Try now.
Do I have to delete Zedgraph and make a fresh install?
I tried making a new sheet with a new Zedhgraph - still "x - not defined" when if() is used in the function.

WroteNo, you must update it using the main menu: Tools\Plugins (Local Storage) - ZedGgraph Region (Update).
I went to the plugin manager to check, but I didnt check the online gallery, thus there was no update for me.
I updated from online gallery now and it works! Both the option for "IsUseTenPower" and plotting a function with if() conditional.
I am a very happy camper now. Thank you very much!
WroteI think it is possible if I change the plugin. I'll try do that.
Maybe not needed at all. My ZedGraph ancestor plots data OK.
Some patient Collab might be willing. I hate that beast, it punishes me !
As it plots data, for multiple plot will have to be dressed in matrix,
then collect each plot piece.
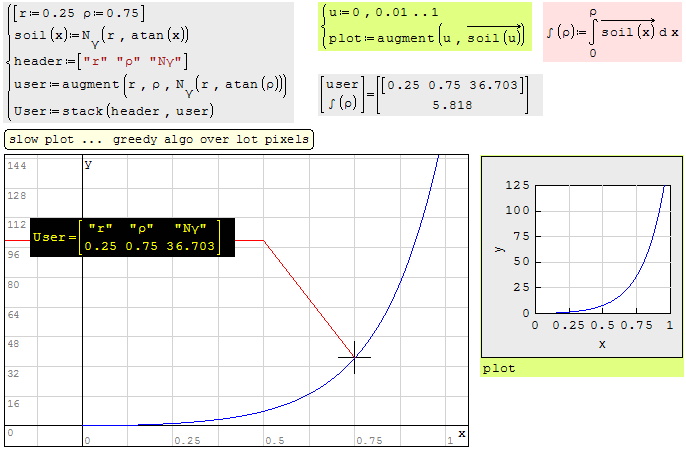
Project Hanski Soil Drainage Ng User.sm (313 КиБ) скачан 1177 раз(а).
WroteI think it is possible if I change the plugin. I'll try do that.
The external design is not yet fully tested, but you can do this.
another question - is it possible to have a "dynamic" number format? such that 100 is written as 100 and not 100.0, while 0.1 is written as 0.1?
I don't speak enough Aliens to finish a presentable plot.
subdivide X axis, make tick labels visible rather than microscopic...
Project Hanski Soil Drainage Ng User.sm (586,4 КиБ) скачан 1229 раз(а).
Wroteanother question - is it possible to have a "dynamic" number format? such that 100 is written as 100 and not 100.0, while 0.1 is written as 0.1?
Try Scale.Format = g2 or g3
WroteWroteanother question - is it possible to have a "dynamic" number format? such that 100 is written as 100 and not 100.0, while 0.1 is written as 0.1?
Try Scale.Format = g2 or g3
Worked like a charm! One last request (I think) - is it possible to have the minor and major step linear while using a log scale?
Now my major steps are 0,1 1 10 and 100. Is it possible to divide each range in 10?
Project Hanski Soil Drainage Ng ZedGraph.sm (395,17 КиБ) скачан 1147 раз(а).
Wroteis it possible to have the minor and major step linear while using a log scale?
The major'y' grids are linear wrt the pixels in height,
but not the labels [naturally]. Minor grids are confusing.
Thus the idea of tracking and display the XY coordinates.
Jean
- insert a zedgraph region
- set YAxis> Type to log.
This freezes the UI, only option is to kill SMath in the program manager. Version 8348.
I understand that log axes must have positive limits. Just a hint on a trap for uncautious users.
- Новые сообщения
- Нет новых сообщений