1 страниц (16 вхождений)
Interaction Diagram for Rectangular Reinforced Concrete Sections (ACI 318) - Сообщения
I've attached a file to generate the Compression and Bending Interaction diagram for rectangular sections, using ACI 318-11.
Any SI and US customary units work, but the results are in kN-m, which can be switched manually if you know where to look.
The rebar area and location column vectors can be made larger or smaller with no effect to the algorithm, So any number of steel layers can be used.
Future work: Expanding on this to include Biaxial Bending using the Reciprocal Load method. I had done this previously with MathCAD, and am currently working on a version for smath. I am having trouble getting it to be done without human input at certain points, but will keep working on it.
Please upload any improvements done to this file and post if any mistakes are found or if you have any suggestions.
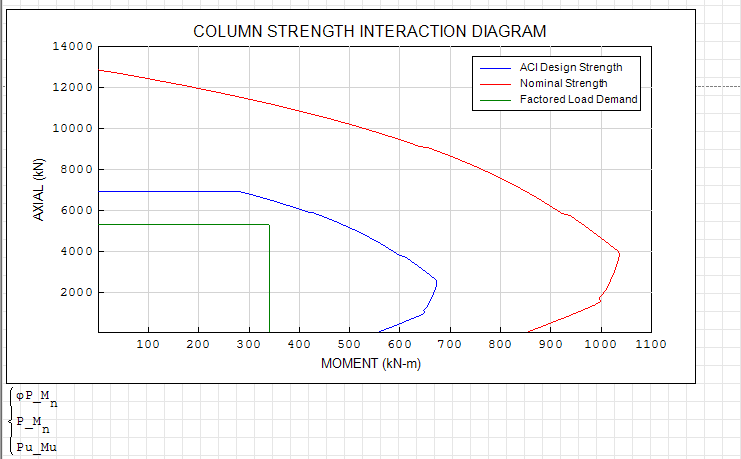
Updated: Automatic scaling of the plot has been implemented. Also previously the section was treated as compression controlled, now the transition from compression controlled to tension controlled is taken into account.
Any SI and US customary units work, but the results are in kN-m, which can be switched manually if you know where to look.
The rebar area and location column vectors can be made larger or smaller with no effect to the algorithm, So any number of steel layers can be used.
Future work: Expanding on this to include Biaxial Bending using the Reciprocal Load method. I had done this previously with MathCAD, and am currently working on a version for smath. I am having trouble getting it to be done without human input at certain points, but will keep working on it.
Please upload any improvements done to this file and post if any mistakes are found or if you have any suggestions.
Updated: Automatic scaling of the plot has been implemented. Also previously the section was treated as compression controlled, now the transition from compression controlled to tension controlled is taken into account.
1 пользователям понравился этот пост
ioan92 20.06.2015 03:55:00
Ernesto,
Very nice! Thanks!
Here is one thought I have when creating calculations. With your current setup you can really only use this one calculation on one page, right? Otherwise you would get into trouble of overwriting variables. I have been trying to take the calculation like you have created and turn it into a large function. This way you can use this for multiple beams on a single smath "page" (meaning a single .sm file). I think this is much more efficient especially if trying to print multiple beams/pages. But maybe there is a different way and even using function you have to be careful how you name your variables (the # symbol at the end of the variable seems to be a popular way to do it on smath).
Anyway thanks for posting.
I have reproduced the diagram in Maxima Draw2D with automatic scaling (except for the x ticks, which are hardwired). Also, I parametrized the usage of units in the plot. One might even use radiobutton list regions for unit selection and having appropriate dynamic labels in the diagram.
P-M-Interaction_Kr.sm (182,88 КиБ) скачан 1530 раз(а).
P-M-Interaction_Kr.sm (182,88 КиБ) скачан 1530 раз(а).
Technische Mechanik mit SMath Studio: https://link.springer.com/book/10.1007/978-3-658-50592-9
RFreund: I'm also playing around with making it a larger function, but still along the same lines as I currently have it. Just making the functions dependent on more variables. I still want to keep it clear where each step comes from without making it so overly complicated where someone may get lost following it. This way I can add bending in the y-axis more easily. Which would lead me to my next step of incorporating the Reciprocal Load Method for checking biaxial bending and compression. Hopefully I will get around to doing that soon. I will post it once I get everything working correctly in biaxial bending.
I am wary of making a sheet that does multiple beams on the same sheet, as that takes away from the clarity of the calculations. This is another challenge of itself, scaling these things up in a way that someone else can follow what you are doing to audit your calculations. My objective is not to make a black box where things magically appear, but clear steps where other engineers can easily verify my work.
mkraska: Thanks for taking the initiative with the plot! The scaling looks great. I don't have any experience with the Maxima Draw2D and am carefully checking out your code to see what I can get out of it.
Thanks again!
Ernesto: Yes that is the 'rub' I suppose. I started using Smath to create very clear/comprehensible calculations. Now that they are clear I am trying to turn them into a black box (or so it seams), which would be more geared towards production. However, the advantage is that there is the option to view the "code" behind the black box. In any case good work!
I have the motivation to create a more general "rigorous" axial and biaxial bending function but just don't seem to have the time.
I have the motivation to create a more general "rigorous" axial and biaxial bending function but just don't seem to have the time.
Ernesto:
I'm curious how you chose (h.x * 1.4) * 0.005m for the interval of iteration?
I'm curious how you chose (h.x * 1.4) * 0.005m for the interval of iteration?
RFreund: I updated the file just now with the reasons described in the first post.
I actually increased it to (h.x*1.6)*0.005m. I chose the interval (0.005m) just so the plot wouldn't look sluggish for small sections. Another way to do this is based on the percentage of the section size so there would be the same number of data points for small sections as large sections, this would probably be more efficient but didn't think of it at the time .
.
The range for the iteration (1.6) was chosen from trial and error, trying different section sizes and verifying if the range was adequate (if all the data points required to complete the plot were generated) , while at the same time keeping the range as small as possible to save on computing time.
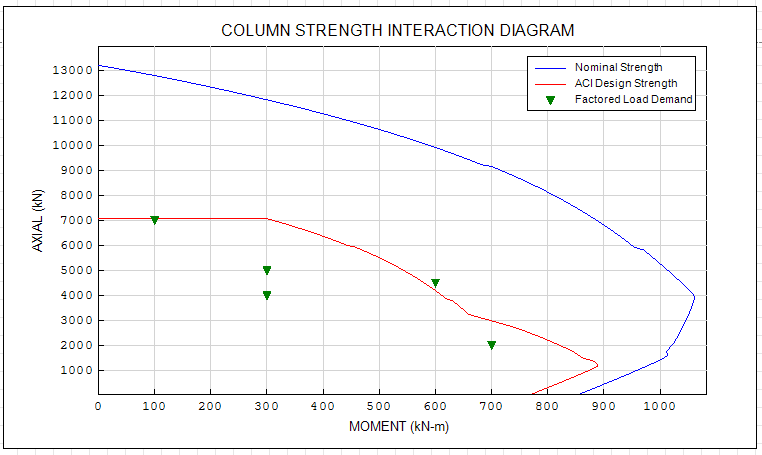
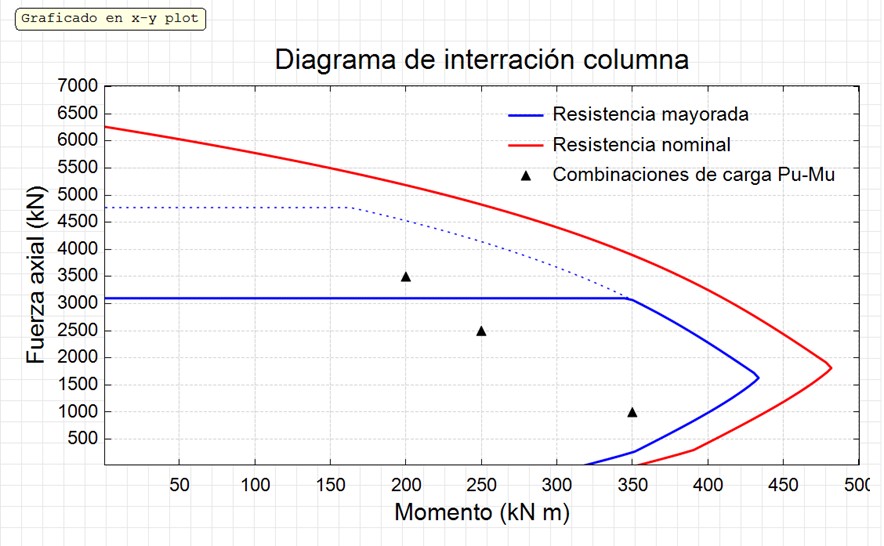
I was thinking about what you said before about checking various columns in one sheet. One way I was playing with is to have one sheet for one section size, but used in multiple column locations so there would be different loads to check, and plotting those points to see if they are in the envelope or not. But with the X-Y plot I'm using, I haven't figured out a way to differentiate those points with one another (with labels or in the legend). (see attached image).
I actually increased it to (h.x*1.6)*0.005m. I chose the interval (0.005m) just so the plot wouldn't look sluggish for small sections. Another way to do this is based on the percentage of the section size so there would be the same number of data points for small sections as large sections, this would probably be more efficient but didn't think of it at the time
.The range for the iteration (1.6) was chosen from trial and error, trying different section sizes and verifying if the range was adequate (if all the data points required to complete the plot were generated) , while at the same time keeping the range as small as possible to save on computing time.
I was thinking about what you said before about checking various columns in one sheet. One way I was playing with is to have one sheet for one section size, but used in multiple column locations so there would be different loads to check, and plotting those points to see if they are in the envelope or not. But with the X-Y plot I'm using, I haven't figured out a way to differentiate those points with one another (with labels or in the legend). (see attached image).
Thanks for the Response Ernesto.
You know, another nice feature would be if there was a way to check if the point falls within the curve, then return an "OK" or "NG" or something along these lines. Of course it is easy enough to visually compare but it would still be neat.
I've attached a spreadsheet which is for masonry shear walls, but they use a close range liner interpolation technique it seems.
Axial_and_Flexure.xls (134,5 КиБ) скачан 1024 раз(а).

To accomplish the task you can use the even-odd rule.
Attached an example.
Check.sm (15,7 КиБ) скачан 1234 раз(а).
Attached an example.
Check.sm (15,7 КиБ) скачан 1234 раз(а).
If you like my plugins please consider to support the program buying a license; for personal contributions to me: paypal.me/dcprojects
Hi,
I need a compression and bending interaction diagram for my master's dissertation. I have downloaded the file and input the values of my column into the smath sheet. However. when i recalculate the page, it does not update the diagram.
How do i update the diagram to match up with my input data?
Any help would be appreciated.

Russia ☭ forever, Viacheslav N. Mezentsev
WroteWith X-Y Plot
P-M-Interaction_Modify.sm (60,48 КиБ) скачан 1179 раз(а).
P-M-Interaction_Kr.sm (48,25 КиБ) скачан 1396 раз(а).
The smath sheet you provided is very useful.
I have a question.
1) An error occurs when the length of the column becomes longer.
ex) hx = 4000 mm
2) I want to find n value that satisfies Pnx = pu.
when I use the solve() function, an error occurs.
Is there a way to fix it?
how can find n value ?
Please refer to the attached sheet
Hi.
The formulae for apply is valid only for certain ranges. You can see that the surface is outside the required range (by the norm), so, the SMath error actually is irrelevant: what it's important is the red in the worksheet:
Solvers are unstables, except maybe for al_nleqsolve. But here, and similar cases, you can implement always your own solver:
Best regards.
Alvaro.
Wrote
I have a question.
1) An error occurs when the length of the column becomes longer.
ex) hx = 4000 mm
The formulae for apply is valid only for certain ranges. You can see that the surface is outside the required range (by the norm), so, the SMath error actually is irrelevant: what it's important is the red in the worksheet:
Wrote
2) I want to find n value that satisfies Pnx = pu.
when I use the solve() function, an error occurs.
Is there a way to fix it?
how can find n value ?
Solvers are unstables, except maybe for al_nleqsolve. But here, and similar cases, you can implement always your own solver:
Best regards.
Alvaro.
Wrotewhen Iuse the solve() function, an error occurs.Is there a way to fix it?
... more solvers in there.
Solve Dichotomy.sm (19,94 КиБ) скачан 1133 раз(а).
Solve roots Newton-Raphson.sm (51,33 КиБ) скачан 1143 раз(а).
Solve roots_solve RootSecant (1).sm (104,62 КиБ) скачан 1140 раз(а).
WroteWrotewhen Iuse the solve() function, an error occurs.Is there a way to fix it?
... more solvers in there.
Solve Dichotomy.sm (19,94 КиБ) скачан 1133 раз(а).
Solve roots Newton-Raphson.sm (51,33 КиБ) скачан 1143 раз(а).
Solve roots_solve RootSecant (1).sm (104,62 КиБ) скачан 1140 раз(а).
Thank you for your answer.
Have a nice day.
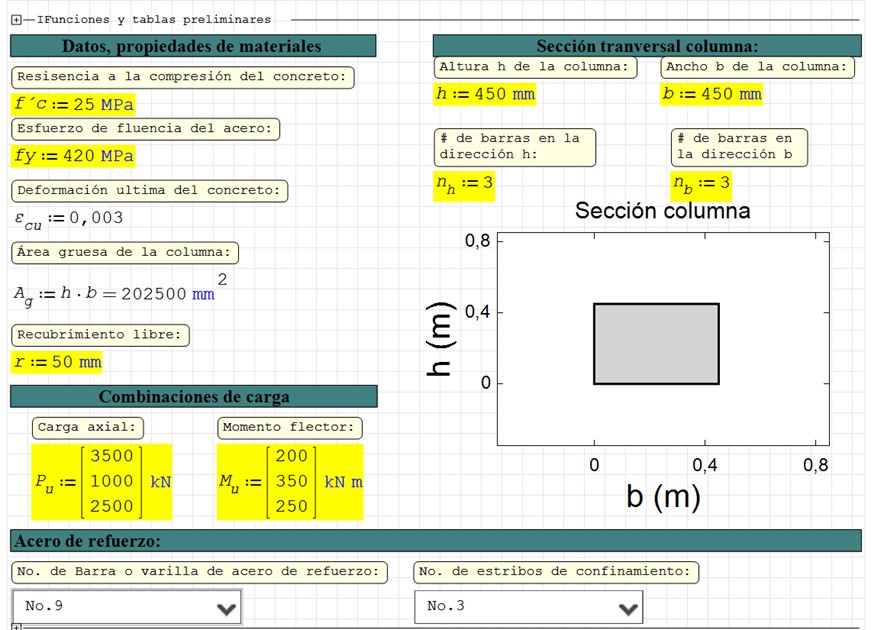
I had made my own code, but I was missing graphing, I took as a guide the code previously published here and additionally I added the graph the cross section of the column and the load combinations P-M, it would be missing to add the steel bars to that section to have a better graphical interface.
I will work to complement the code with bresler's reciprocal load method.
Diagrama de interaccion.sm (848,38 КиБ) скачан 1261 раз(а).
I will work to complement the code with bresler's reciprocal load method.
Diagrama de interaccion.sm (848,38 КиБ) скачан 1261 раз(а).
2 пользователям понравился этот пост
1 страниц (16 вхождений)
- Новые сообщения
- Нет новых сообщений