1 страниц (4 вхождений)
X-Y Plot and ZedGraph do not plot constant values - Constant can be plotted only as a function f(x):=const - Сообщения

SMath Studio version: 0.99.7808 and previous stable release.
OS: Windows XP, Windows 7.
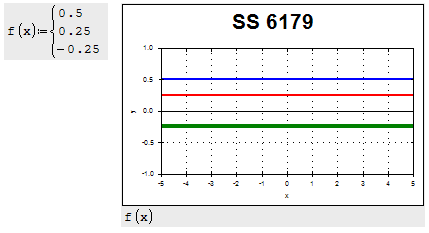
The plug-ins X-Y Plot and ZedGraph do not plot constant values.
Pop-up error message:
"The specified argument is outside the range of valid values.
Parameter Name: arrayIndex"
Constant value do not plotted in both cases:
as a number or as a variable name.
The only way to plot it is to define constant function y(x):=const
and then plot the y(x).
In the earlier releases of SMath Studio both plug-ins worked similar to the standard 2D plot.


OS: Windows XP, Windows 7.
The plug-ins X-Y Plot and ZedGraph do not plot constant values.
Pop-up error message:
"The specified argument is outside the range of valid values.
Parameter Name: arrayIndex"
Constant value do not plotted in both cases:
as a number or as a variable name.
The only way to plot it is to define constant function y(x):=const
and then plot the y(x).
In the earlier releases of SMath Studio both plug-ins worked similar to the standard 2D plot.
2 пользователям понравился этот пост
Your version has to be doctored or use as previous versions.

It is not about a version, but about the settings.
Issue is reproduced and will be fixed asap.
Best regards.
Issue is reproduced and will be fixed asap.
Best regards.
Fixed. Fix will be a part of the next release.
1 страниц (4 вхождений)
- Новые сообщения
- Нет новых сообщений