3D plots in XY Plot plugin - Сообщения

Perhaps you have enough desire to try to implement this algorithm (Ray Marching).
It would be possible to create a plugin based on this way of displaying bodies in space.
WroteThis is cool.
Perhaps you have enough desire to try to implement this algorithm (Ray Marching).
It would be possible to create a plugin based on this way of displaying bodies in space.
Let me see what I can do
Meanwhile I leave you these comments.
pMesh(1) gives the same answer than yours Createmesh. You can easily modify your code for adapt it as a new other function, maybe XYPlotShow or something else, identifiying the loops. There are the same, I check your Createmesh long time ago. Array S stores “polygon” or “polyline” if the colormap for surfaces is zero, and L stores “polylines” always, and are not filled like the polygons never. Thus, L are in the beginning, and what I see is that you need only let S as it is, or reversing it. My guess is that we only need to take the distances from some “ViewPoint”, not only two angles, but cannot found it. Also, notice that I take the bottom of each polygon for the colormap, and nothing else like averages. This way maybe is not the correct, but it is very fast, assigning before the main loops a complete array of color indices. Wolfram Mathematica use a 3D point as the view point as option, and maybe that’s more correct.
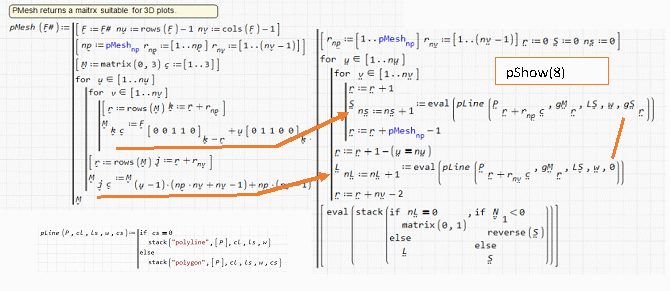
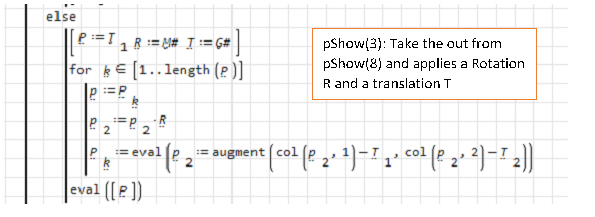
pSurf(3): This other could be interesting too, even I don’t show how to use because don’t test it too much (well, nothing). First two are for mapcolored “vf” vector field, “ip” implicit plots, but third option, when isn’t an string first parameter, for take P = pShow(8) and rotate by R and translate by T.
By this way you can plot the surface with some (az,el) and then replot for (90 deg, 0 deg), rotate and put down, like matlab surfc. Notice that the last parameter for pShow(8) is for which axis is the colormap, d=3 is the default for z=col(mesh,3). This is the output of matlab surfc:

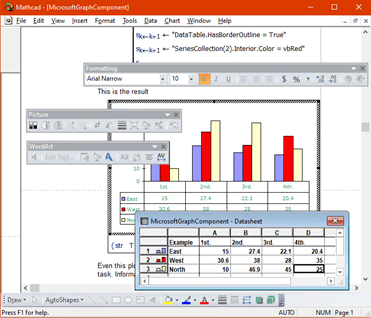
About other graphing options, my opinion is that MSChart component could be very important because they could export to Excel, if not easy, at least you ensure that. I attach my Mathcad 11 mschart component. It is implemented as a general ActiveX component in Mathcad. If you edit it’s code, you can see that the important code is:
ExecuteGlobal str + "End With"
MicrosoftGraphComponent.pdf (591,9 КиБ) скачан 511 раз(а).
This technique is based in this other files:
VBS.pdf (341,61 КиБ) скачан 496 раз(а).
Documenting Components.pdf (498,47 КиБ) скачан 480 раз(а).
Those files was published in the Mathcad advisor newsletter or something like that.
Backing to the mschart, if you now double click on it, you get the Microsoft environment for modify the plot, even it’s not saved you can found the way to get it. Look at the toolbars, are from Microsoft, not Mathcad. At the bottom you have also the sahpes toolbar!
There are too many functions and they make it difficult to find functions in the SMath insert functions dialog. I think you should implement it as a single dislin function (str, a, b, c, ...) where str is the dislin instruction and the rest the arguments for that instruction.
You shouldn't let the user have to choose a file name and location to later display the graph in the image component. You can take the component directory, as you do in other plugins, or the temporary one in windows and make, for example, dislin ("disfin", 0) return the name of the file you have generated, with the full path, to insert it as final part of the component.
But the biggest problem with dislin is this other:
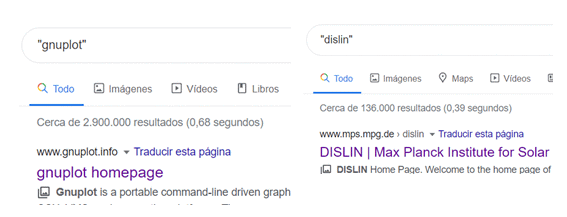
My recommendation is that if you do that for other software (my recommendation is gnuplot, which was already highly commented on in this forum) you would already have the complete graphics package.
The other option is that instead of integrating a function gnuplot (string, a, b, c, ...) and that has as its starting point gnuplot ("start", "figure_name") the end of the code gnuplot ("end", " figure_name ") and the latter returns in full path to be the argument of the image component, create a text region and follow the same philosophy as the mathcad component scripts.
Finally, it would be interesting if some of your components had some instruction similar to matlab's ginput. Besides a lot of games, like lunar landing, other things could be done:
unplot_manual_interpolation.pdf (538,41 КиБ) скачан 484 раз(а).
Mathcad 11 files:
mcad_files.zip (985,07 КиБ) скачан 245 раз(а).
Best regards.
Alvaro.
I collect not only libraries, but also ways to connect them. Unfortunately, many of these methods are complex.
We still don't have a video tutorial on how to create complex plugins. Probably things would have gone faster if we had such examples. I don't speak English enough to tell how it's done.
Your examples are interesting enough, but modern visualization tools should be able to do all this and do it much faster.
To connect the MS Chart component, I used a not very good trick. One of the disadvantages of this method is that the image is rasterized, not vector. This component cannot be used on any other OS. In my opinion, we need to pay more attention to the components for which there are source codes, improving them. Documents that use such components will be more versatile.
WroteI have connected many different libraries to the program as plugins. One of the goals was to show how this can be done. Each method has its own pros and cons.
Yes, you're right, you show how to do that in a amazing number of ways.
Wrote...
The first external symbolic plugin was the Maple Wrapper. It was an experimental method, but thanks to it, a way to connect Maxima appeared.
I know that. I'm the guy that suggest you to not use the Mathcad Maple's release MapleVR4 but MapleVR5 because the strings identifier.
Wrote...
In this sense, it doesn't matter how popular a particular tool is. What matters is the way in which it can be connected.
I make this observation because precisely this point
WroteIn my opinion, we need to pay more attention to the components for which there are source codes, improving them. Documents that use such components will be more versatile.
gnuplot not only have free source code, but also have a lot of examples about how to implement it, and I assume by different methods. Is in that sense that I prefer "popular" apps, not other.
WroteTo connect the MS Chart component, I used a not very good trick.
It's time for SMath to have OLE or ActiveX services or whatever is used with C sharp
Wrote...
We still don't have a video tutorial on how to create complex plugins. Probably things would have gone faster if we had such examples. I don't speak English enough to tell how it's done.
Me less! But we have the automatics translation as subtitles from youtube.
Best regards.
Alvaro.
- Новые сообщения
- Нет новых сообщений