1 страниц (20 вхождений)
Questions of graph of a function - Сообщения
Hello! Please tell me for 2 questions:
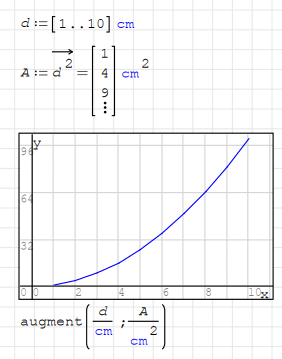
1) How to build a graphs of function if the document has units of measurement? If I do "Ignore inits", then everything works. But I would like to with units of measurements
111.sm (33,1 КиБ) скачан 923 раз(а).
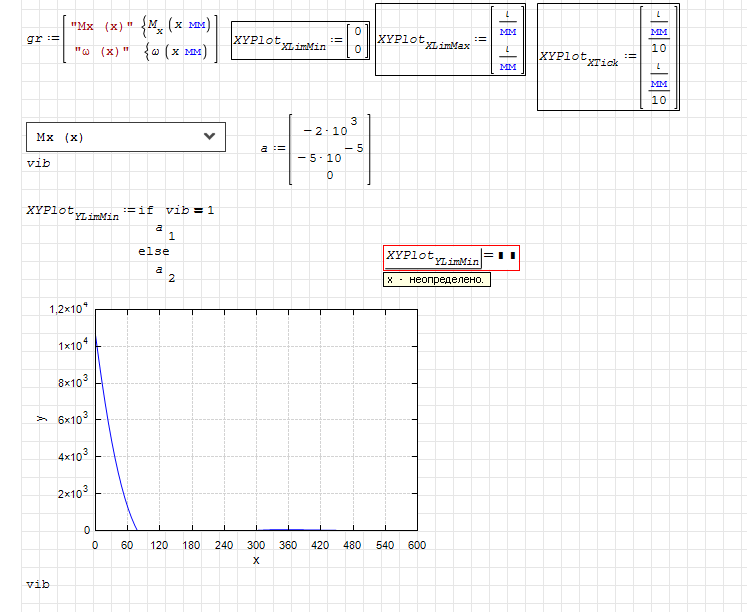
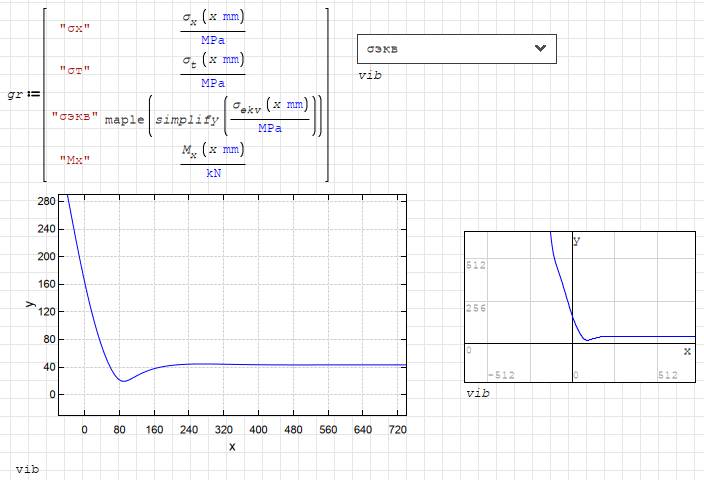
2) Using plugin ComboBox I want to build graphs of 4 functions
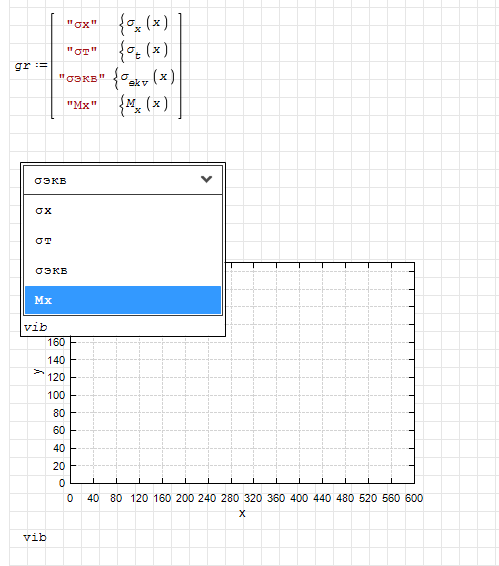
Graphs of functions σ.x(x), σ.t(x), Mx(x) are built.
Файл не найден. Файл не найден. Файл не найден.
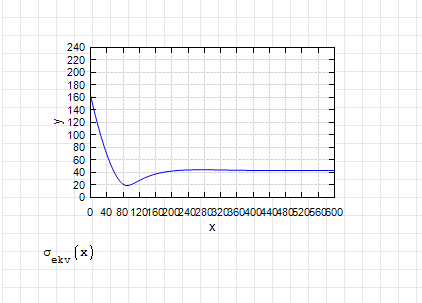
Graph of functions σ.ekv(x) is not build. Why?

1) How to build a graphs of function if the document has units of measurement? If I do "Ignore inits", then everything works. But I would like to with units of measurements
111.sm (33,1 КиБ) скачан 923 раз(а).
2) Using plugin ComboBox I want to build graphs of 4 functions
Graphs of functions σ.x(x), σ.t(x), Mx(x) are built.
Файл не найден. Файл не найден. Файл не найден.
Graph of functions σ.ekv(x) is not build. Why?
Don't "Ignore units", eliminate them.
Easiest way is to divide.
Regards
Easiest way is to divide.
Regards
WroteDon't "Ignore units", eliminate them.
Easiest way is to divide.
Regards
In my example it doesn't work like that.

Очень странное поведение, возьму на заметку. Компоненту не нравится выражение под знаком корня.
Russia ☭ forever, Viacheslav N. Mezentsev
The success of plotting seems to depend on how the expression is accessed. Possibly it is a Combobox issue.
BTW, in Maxima, the intermediate definition of P is not required. This is a necessary step for X-Y Plot only.
![2024-07-31 21_53_39-SMath Solver - [111_Kr.sm_].png](/ru-RU/files/Download/hFUUmx/2024-07-31-21_53_39-SMath-Solver---[111_Kr.sm_].png)
111_Kr.sm (60,2 КиБ) скачан 890 раз(а).
BTW, in Maxima, the intermediate definition of P is not required. This is a necessary step for X-Y Plot only.
111_Kr.sm (60,2 КиБ) скачан 890 раз(а).
Martin KraskaPre-configured portable distribution of SMath Studio: https://en.smath.info/wiki/SMath%20with%20Plugins.ashx
WroteОчень странное поведение, возьму на заметку. Компоненту не нравится выражение под знаком корня.
Если строить график отдельно, то он строится, проблем нет. Именно при Combobox'е не хочет
WroteThe success of plotting seems to depend on how the expression is accessed. Possibly it is a Combobox issue.
BTW, in Maxima, the intermediate definition of P is not required. This is a necessary step for X-Y Plot only.
111_Kr.sm (60,2 КиБ) скачан 890 раз(а).
Thanks for the answer!
How can I replace it?
on this
WroteIn my example it doesn't work like that.
I only meant to say don't ignore units unless it is utmost necessary.
Here is your file totally working with units and plotted.
111_examination.sm (38,72 КиБ) скачан 951 раз(а).
When I talk about your problem, I guess it is a parse bug of combobox.
Because it can plot normally when function called directly.
And radiobutton and combobox list is not affected if you use like this.
Файл не найден. Файл не найден.
This combobox issue is not limited to XYPlot, 2DPlot is affected too.
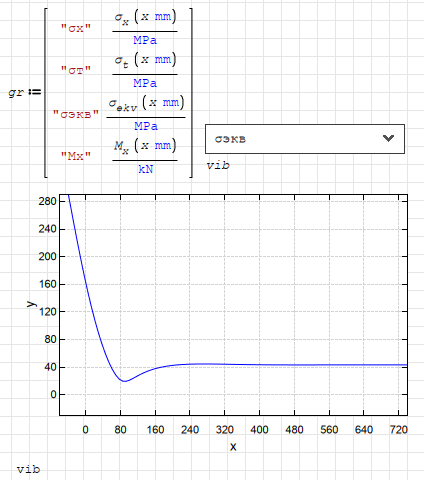
When combobox result is directly your symbolic function, it doesn't work.
However, when your function is simplified someway, it can be plotted.
This bug should be examined by author of combobox plugin.
Regards
Wrote
Thanks for the answer!
How can I replace it?
on this
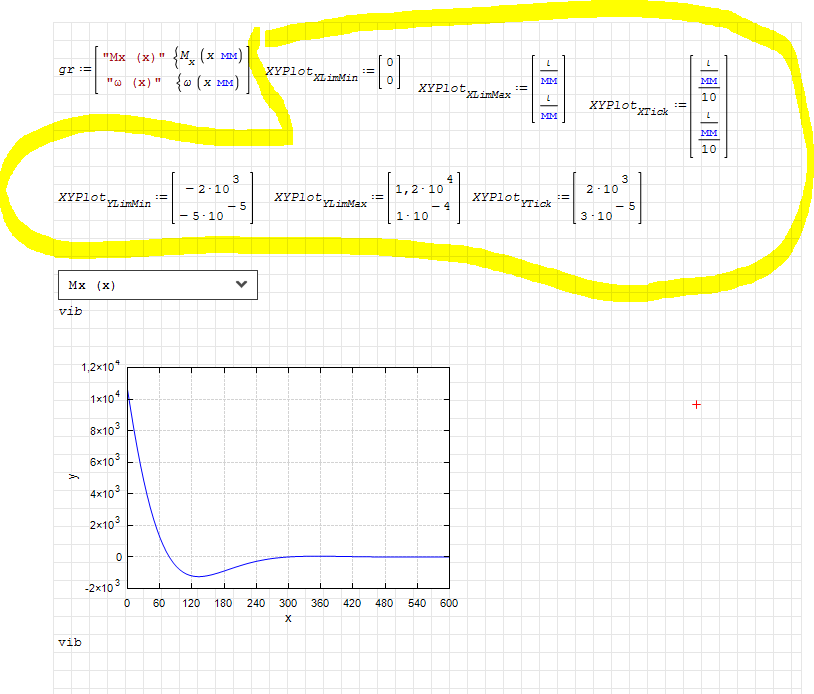
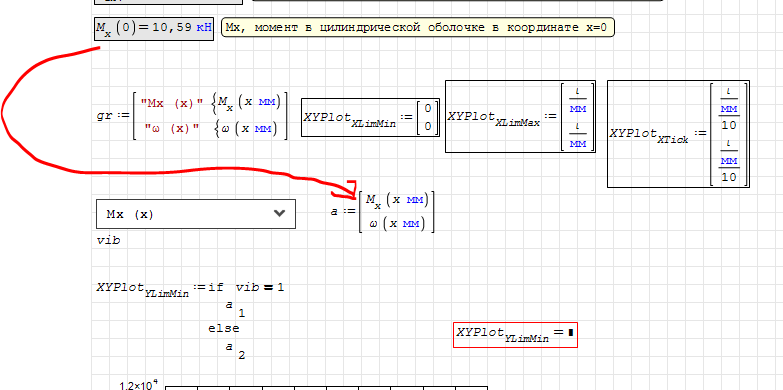
I guess you want to set the limits depending on the selected function.
Let the combobox return the index of the selection and then use it to pick the appropriate values from lists.
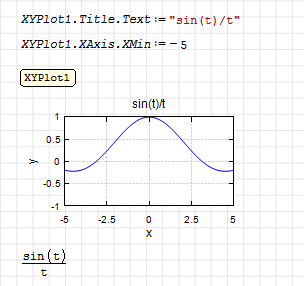
In Maxima, you also can set the axes labels and the trace legend text using SMath expressions.
Martin KraskaPre-configured portable distribution of SMath Studio: https://en.smath.info/wiki/SMath%20with%20Plugins.ashx
Most of time, eval() or line() is your friend.
This change made your function available to plot.
Regards

This change made your function available to plot.
Regards
1 пользователям понравился этот пост
Вячеслав Мезенцев 03.08.2024 23:12:00
Thanks everyone for your answers!
WroteWrote
Thanks for the answer!
How can I replace it?
on this
Let the combobox return the index of the selection and then use it to pick the appropriate values from lists.
In Maxima, you also can set the axes labels and the trace legend text using SMath expressions.
Can you tell us more?
If possible with an example.
Yes, I would like to substitute values from the results for set the limits
![2024-08-04 22_47_06-SMath Solver - [111_Kr.sm_].png](/ru-RU/files/Download/QBbUhw/2024-08-04-22_47_06-SMath-Solver---[111_Kr.sm_].png)
Martin KraskaPre-configured portable distribution of SMath Studio: https://en.smath.info/wiki/SMath%20with%20Plugins.ashx
Wrote111_Kr2.sm (60,85 КиБ) скачан 899 раз(а).
I like the way limits determined by YLimMin, XLimMax, etc.
However, if you rename XYPlot to XYPlots or Plot1 or whatever, this method doesn't work particular plot.
Actually, all XYPlot are affected by XYPlot.option disregarding name of plot.
Is this a bug or a feature?
Regards
1 пользователям понравился этот пост
sergio 05.08.2024 15:36:00
As far as I understand, you can control multiple plots individually by providing vector values to the XYPlot-variables. In the settings you select select SourceType->PropertyGrid and provide the index to use for accessing the values.
You find an example in the interactive handbook (Plugins->X-Y Plot Region).
You find an example in the interactive handbook (Plugins->X-Y Plot Region).
Martin KraskaPre-configured portable distribution of SMath Studio: https://en.smath.info/wiki/SMath%20with%20Plugins.ashx
1 пользователям понравился этот пост
sergio 05.08.2024 15:36:00
Wrote111_Kr2.sm (60,85 КиБ) скачан 899 раз(а).
Thank you very much! That's what I needed.
The only question is: does SMath have auto-scaling of axes as it was in Mathcad? this would greatly simplify the process)
Использование Properties source - это исторически первый способ управления компонентом из документа, он был оставлен для совместимости со старыми документами.
Автомасштабирование в компоненте XY Plot не реализовано из-за того, что я не нашел удобного алгоритма поведения для комбинации явных и неявных графиков. Для отображения неявного графика область должна быть задана конкретно, а для автомасштабирования наоборот не задана.
Автомасштабирование в компоненте XY Plot не реализовано из-за того, что я не нашел удобного алгоритма поведения для комбинации явных и неявных графиков. Для отображения неявного графика область должна быть задана конкретно, а для автомасштабирования наоборот не задана.
Russia ☭ forever, Viacheslav N. Mezentsev
WroteWrote111_Kr2.sm (60,85 КиБ) скачан 899 раз(а).
I like the way limits determined by YLimMin, XLimMax, etc.
However, if you rename XYPlot to XYPlots or Plot1 or whatever, this method doesn't work particular plot.
Actually, all XYPlot are affected by XYPlot.option disregarding name of plot.
Is this a bug or a feature?
Regards
I can add this option to customize the properties
Russia ☭ forever, Viacheslav N. Mezentsev
hi, For some reason the "Property source" is not shown now. I am using version 1.2 build 9018 dated 09-sep-2024.
how to assign/control plot properties now?

how to assign/control plot properties now?
Russia ☭ forever, Viacheslav N. Mezentsev
1 страниц (20 вхождений)
- Новые сообщения
- Нет новых сообщений