1 Pages (12 items)
Trouble Graphing Indexed Values - Graphing Indexed Values - Messages
#1 Posted: 1/18/2020 6:34:50 PM
Hi Everyone!
I am having some issues with graph indexed values in SMATH.
I am currently attempting to copy this app note here:
APP NOTE
In an attempt practice my smath.
My file may be found here V2_Input_Filter_Test.sm (81.88 KiB) downloaded 834 time(s).
I am currently stuck on attempting to replicate page 14-15 of the TI APP note.
this boils down to 3 questions:
[list]While i am attempting to define an index value, i get a persistent error even though the equation solves fine I am still unsure as to how to what is the proper syntax on how to graph the transfer function I am struggling to understand how why my new filter impedance is not graphing
Thank you all in advance!
I am having some issues with graph indexed values in SMATH.
I am currently attempting to copy this app note here:
APP NOTE
In an attempt practice my smath.
My file may be found here V2_Input_Filter_Test.sm (81.88 KiB) downloaded 834 time(s).
I am currently stuck on attempting to replicate page 14-15 of the TI APP note.
this boils down to 3 questions:
[list]
Thank you all in advance!
#2 Posted: 1/19/2020 7:06:46 AM
Hi. Your issue is very small: you put some assignment 'j:=' in the sub-index, not globally.
V2_Input_Filter_Test.sm (80.92 KiB) downloaded 834 time(s).
Best regards.
Alvaro.
V2_Input_Filter_Test.sm (80.92 KiB) downloaded 834 time(s).
Best regards.
Alvaro.
#3 Posted: 1/20/2020 10:17:13 AM
WroteI am struggling to understand how why my new filter impedance is not graphing
Does it plot on your SS version ?
V2_Input_Filter_Test [or like tis in red].sm (69.01 KiB) downloaded 625 time(s).
#4 Posted: 1/20/2020 11:06:49 PM
WroteHi. Your issue is very small: you put some assignment 'j:=' in the sub-index, not globally.
This is interesting to me... I saw that you were able to make the Z2_j variable match the Z1_j however whenever I attempt to re-type the Z2_j definition as soon as I imput the 1/(s_j * Cin) statement it puts that "j" in the sub-index and doesn't allow me to edit it in a meaningful way.
So far the only way I have found to fix this is to put in like so: Z2 = "equation here"
Then once I have the equation finished inputting the defining equation, I go back to the Z2 equation and make it into a vector element, i.e. Z2_j = "equation here"
Must be a "feature" lol.
#5 Posted: 1/20/2020 11:53:23 PM
WroteWroteI am struggling to understand how why my new filter impedance is not graphing
Does it plot on your SS version ?
When I downloaded the version that had those edits it showed that exact graph that you have posted.
However, whenever I leave the values as i had them without vectoring them get the expected graph, which matches the TI app note. (see picture)

Now what really confuses me the Transfer function plot looks so different. I input it as the App note stated however the graph seems "negated" as opposed to what I would expect.


Any Ideas Ya'll?
Thanks in advance,
Carlo
#6 Posted: 1/21/2020 10:35:03 AM
WroteAny Ideas Ya'll?
Same as the other one ... see reply.
Can't get that picture ?
#7 Posted: 1/22/2020 3:07:02 PM
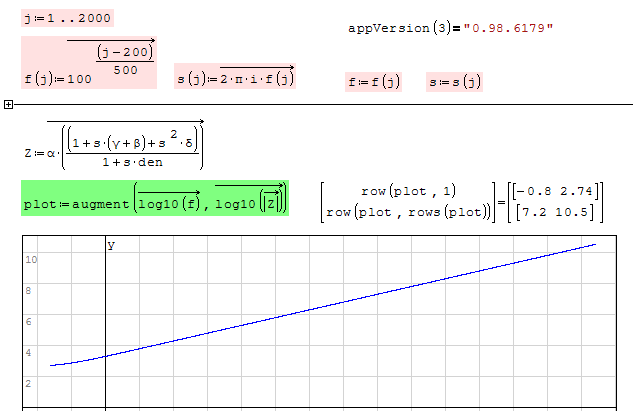
Hi Carlo. You take twice log10. Just augment log10(f) and LC.filter.
Best regards.
Alvaro.
Best regards.
Alvaro.
#8 Posted: 1/22/2020 6:32:49 PM
WroteI am still unsure as to how to what is the proper syntax on how to graph the transfer function
1. This is not XFR [Transfer Function], simply impedance.
2. Dimension the components wrt SI system [see TI values]
4. More help, re-post page 1 working from this document
5. Your version is older than SS 6179 ...
it does not have page # associated with the cursor.
HELPED_Input_Filter_Test_V1 ... first graph doctored NEW.sm (245.89 KiB) downloaded 799 time(s).
#9 Posted: 1/22/2020 9:12:50 PM
WroteHi Carlo. You take twice log10. Just augment log10(f) and LC.filter.
Best regards.
Alvaro.
Hi Alvaro,
I believe that is what I did? (seriously asking here) See picture

#10 Posted: 1/23/2020 2:09:22 AM
Hi. Not in that plot, in the previous:
Bad: Two logs:

Ok: One log:

This other have the same shape, and seems to have the same values than the mathcad plot in the TI app note. Notice that this plot is log only in the x-axis, and the y axis isn't in the log scale in the plot just because you're plotting in dB
The last plot is log in both x and y axis. See the difference in the green lines. So, you correctly take there here log for both axis


Best regards.
Alvaro
Bad: Two logs:
Ok: One log:
This other have the same shape, and seems to have the same values than the mathcad plot in the TI app note. Notice that this plot is log only in the x-axis, and the y axis isn't in the log scale in the plot just because you're plotting in dB
The last plot is log in both x and y axis. See the difference in the green lines. So, you correctly take there here log for both axis
Best regards.
Alvaro
#11 Posted: 1/23/2020 9:37:25 AM
Wrote1. This is not XFR [Transfer Function], simply impedance.
You can de-confuse yourself ...
XFR are always Sigmoid shape, no matter the order of the system.
They belong to Laplace domain system.
Inst_XFR 2nd [XFR nth].sm (250.31 KiB) downloaded 671 time(s).
#12 Posted: 1/29/2020 12:26:59 AM
Thanks to Jean and Razonar I believe we can close this thread up! At least as it pertains to graphing indexed values.
The resulting file may be found here for reference:
HELPED_Input_Filter_Test_V1.sm (87.91 KiB) downloaded 795 time(s).
I have opened a thread here:
Log based X and Y graph thread
This will be an attempt to get my graphs to look more like the following

But hopefully without that horrible green.
The resulting file may be found here for reference:
HELPED_Input_Filter_Test_V1.sm (87.91 KiB) downloaded 795 time(s).
I have opened a thread here:
Log based X and Y graph thread
This will be an attempt to get my graphs to look more like the following
But hopefully without that horrible green.
1 Pages (12 items)
- New Posts
- No New Posts