X-Y Plot Region - Extends SMath Studio with a X-Y Plot Region. - Messages

Wrotethanks uni , it's so convenient to set properties for figures now ,
i wil attach my usage for late-comers to reference .
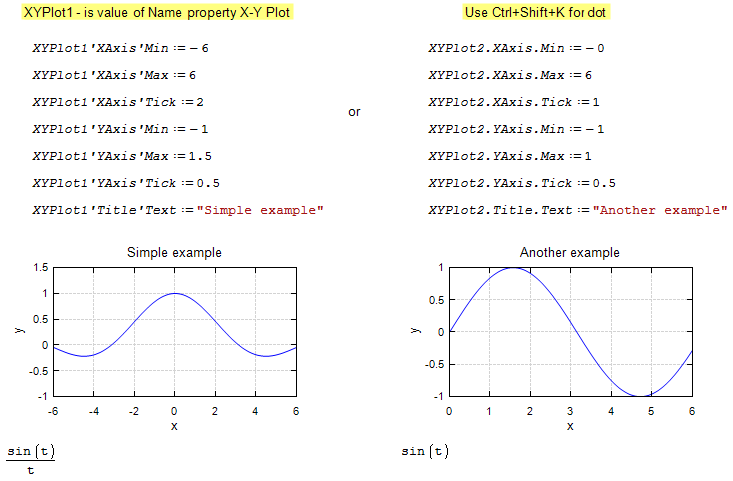
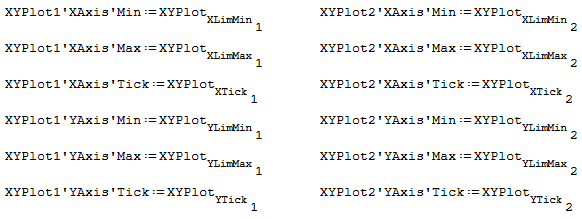
i decide to make it be a snippet , whenever there is a xyplot i'll insert this snippet
Greetings,
With regards to the list of properties you created, I have some updates to your "Legend"
- (...).Legend.TextColor
- (...).Legend.LegendBackColor
- (...).Legend.LegendBorderColor
- (...).Legend.LegendPosition
- (...).Legend.LegendFont
Please take note of the last one as I couldn't get 'position' to work, but 'legendPosition' did provide values. Please note: I am running an older version.
I also believe you are missing 「(...).Grid.IsY2Grid」, which would control drawing the gridlines per the Y2 Axis.
May this be of Good Help;
⚜ Kenny Lemens, P.E. ᵂᴵ
WroteAs an experiment, I may add this feature.
I guess you propose to read the settings from the description. I'd like this feature very much, yet, how to include calculated values?
I'd also propose a Hotkey or context menu item to send the current settings to the description as a template
I like the thought of declaring such settings in the description field, but I would recommend against it. There will be several issues with such an implementation:
- There is a discrepancy between special/encoded characters, may need to manually paste text in for best affect.
- This area doesn't provide the best Copy/Paste experience.
- There is no dynamic assist when typing variables.
- Easy to overlook the description field, may create frustration if person isn't aware that the description is declaring settings.
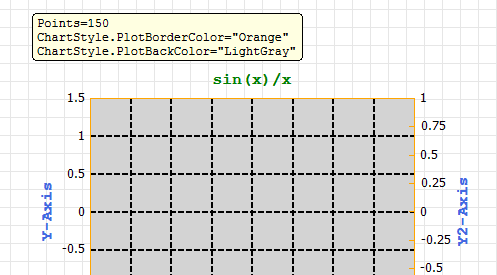
Instead, I would recommend placement of these settings into the input; since setprop() has a Global influence there is no issue with this placement:
_Placement.gif)
May this be of Good Help;
⚜ Kenny Lemens, P.E. ᵂᴵ

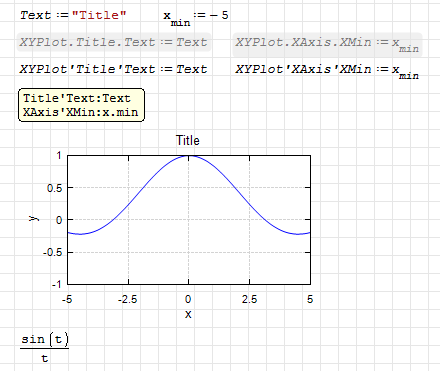
Other symbols are also available:
XYPlot#XAxis#XMin:x.min
XYPlot%XAxis%XMin:x.min
XYPlot~XAxis~XMin:x.min
Plugin updated.
Changes:
- added support for image drawing;
- added support for settings inside the description.
I haven't decided yet how to describe the set of properties in the description. We need to experiment a little.
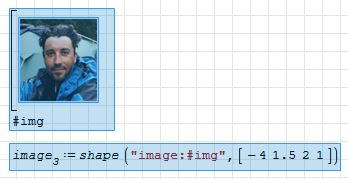
I can try to display the picture from the document if it is marked with tag
xyplot-drawimage.sm (8.99 KiB) downloaded 1081 time(s).
xyplot-drawimage.pdf (28.57 KiB) downloaded 471 time(s).
Wrote...
- added support for image drawing; ...
Hi Viacheslav. Thanks, it works fine. One question: Is there a way to use the RGB matrix of the image, instead of the file?
Best regards.
Alvaro.
QuoteI can try to display the picture from the document if it is marked with tag
Something like this

The release manager is down again, so just an announcement.
It is also possible to draw svg icon sets (favicon, …), but I have not yet decided how to encode them.
xyplot-drawimage-file.pdf (38.33 KiB) downloaded 509 time(s).
xyplot-drawimage-tag.pdf (39.71 KiB) downloaded 531 time(s).
xyplot-drawimage-mat.pdf (41.61 KiB) downloaded 494 time(s).
Plugin updated.

Changes:
- added support for image output (file, tag, mat);
- the oldest method of changing component properties has been removed;
- fixed support for setting properties in the component description;
- minor improvements.

xyplot-drawimage-file.sm (7.89 KiB) downloaded 1164 time(s).
xyplot-drawimage-tag.sm (67.14 KiB) downloaded 1222 time(s).
xyplot-drawimage-mat.sm (8.45 KiB) downloaded 1170 time(s).
Wrote... Plugin updated.
- added support for image output (file, tag, mat); ...
Hi Viacheslav. About 'mat' method, I can't read an image with READRGB, and with image2rgb I don't know how to plot it as RGB (the matrix output from image2rgb is always 1 row by 3 columns containing the 3 matrices R, G and B )
Best regards.
Alvaro.
Wrote
- the oldest method of changing component properties has been removed;
Hi Uni and fellow Smath users,
does this above imply that "setprop" is now not only the preferred way to set plot properties, but also the only one?
I still didn't study it, in case I need to make my homeworks as soon as possible since I have some tools that used the old (deprecated?) way of setting props and autoscaling plots.
Do you have an updated sample file to share, that allows to identify the new way of working with plot properties?
Thanks
xyplot-set-properties-min-example.sm (10.36 KiB) downloaded 1206 time(s).
xyplot-set-properties-support-old-style.sm (6.26 KiB) downloaded 1165 time(s).
xyplot-drawimage-mat-rgb.pdf (86.51 KiB) downloaded 466 time(s).
xyplot-drawimage-mat-rgb.sm (18.24 KiB) downloaded 1159 time(s).
Plugin updated.
Changes:
- added support for rgb image drawing;
- the priority of setting properties has been changed (description - first).
Now the settings from the description are applied first and the settings from the document are applied second. This is done because it is much more difficult to edit the component description than the document itself. If the description is hidden, the properties present there can be overwritten using the settings from the document. Otherwise, as shown above, implicitly changing the properties can become a problem.
Later I will add the ability to copy property sets to a document from the settings form.
Still no fixed features from the MathcadToolbox plugin (READRGB(), ...).
It would be very interesting to be able to obtain the RGB matrix of the image within the Mathcad region, perhaps you can incorporate that option in READIMG(#uni), READ_RED(#uni), ... etc. of the Mathcad toolbox plugin. Not only would it serve to avoid having to attach an external file, but it would also be a way to preserve the changes within the image (those that can be made with the mouse after selecting the "edit" option).
It would also be very useful to have a function similar to Matlab's ginput, such as [X Y]:=XYInput("plot",n) returning two X,Y vectors with n components. The trigger for the action of choosing points could be from the context menu by right clicking on the XYPlot or in some similar way.
Best regards.
WroteIt would be very interesting to be able to obtain the RGB matrix of the image within the Mathcad region, perhaps you can incorporate that option in READIMG(#uni), READ_RED(#uni), ... etc. of the Mathcad toolbox plugin. Not only would it serve to avoid having to attach an external file, but it would also be a way to preserve the changes within the image (those that can be made with the mouse after selecting the "edit" option).
I didn't do it right away because the images form very large matrices. Regular functions don't have access to the sheet area and the list of components, so it can't be done directly. But there is a way to do it differently. We can reread the document itself manually and parse it. I've done this before. So, I think it will be possible to add new functionality to the image handling functions, but only where I am a developer. It should work where there will be read access to the document itself.
WroteIt would also be very useful to have a function similar to Matlab's ginput, such as [X Y]:=XYInput("plot",n) returning two X,Y vectors with n components. The trigger for the action of choosing points could be from the context menu by right clicking on the XYPlot or in some similar way.
As for entering a list of points, this is also possible. I'll even say more, I had thoughts of adding horizontal and vertical markers in any quantity. It's not difficult to draw them, the problem is in outputting information from them to the document. We need to figure out how to do it beautifully and universally.
- New Posts
- No New Posts